 If there’s one tool that every website owner needs to master, it’s Google Analytics. There is no better tool out there for understanding your business and making informed, data-driven decisions.
Today, we’re going to use GA to learn more about your site’s BIG $PENDERS. Ya, you know the ones. These are the customers that spend way more than your average customers on your site.
These are the types of customers that we want to attract more of. That’s why we need to learn more about where they’re coming from and how they behave on your site. Once you know where they come from, you can update your market approach to attract more of them.
So let’s get started…
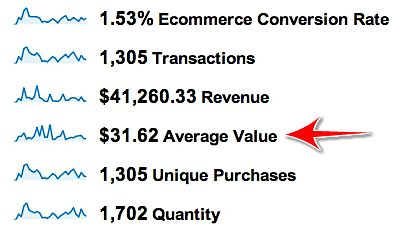
First off, in order to figure out who is spending above average on your site, you need to know what your average is. To find that out, just go check out the standard Ecommerce Overall report in your GA account. It should look something like this:

Now that we know the average, we can go hunting for people who spend more. Let’s say that we want to learn about customers who are spending 50% more than the average. What keywords are they coming in from? What sites are referring them?
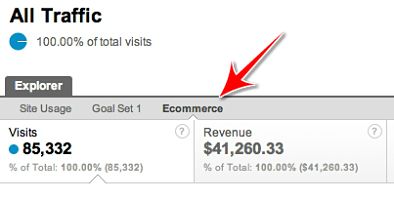
We’ll start by going to view all our traffic sources.

Then we’ll check out the Ecommerce view

Next, you’re going to sort the data according to the Average Value column. That table is going to show you which sources are sending you customers with the highest average order value. Pretty cool, right?
But we can do better…
You might notice when you look at your data that there are a lot of one off referral or keyword sources that are based on only one or two transactions. Depending on the size of your sight and the number of orders that you process every day or month, that data might not be statistically relevant.
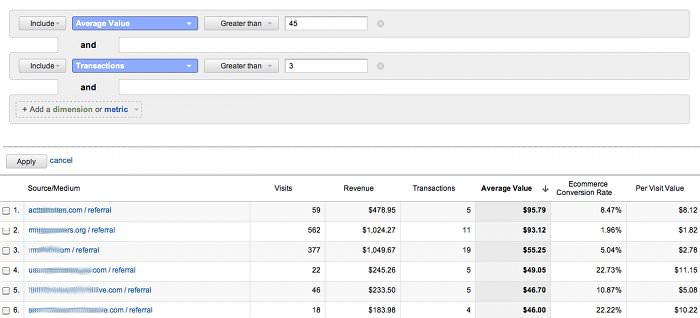
So in order to make sure that we are only looking at traffic sources that are relevant, we’re going to do an advanced search. As you can see from the image below, we want to search for sources that are at least 50% bigger than our average order (in this case, the average is $31, so we are looking for orders over $46). But we are also going to set up our report to only show us those sources that have generated at least 3 sales for us (if you have a very high rate of transactions, you may want to use a larger number here).

As you can see from the data now, we’ve located 5 referring sites that are sending us lots of big spenders. We should definitely investigate how we can target our marketing efforts to bring more traffic from these sources. Things to consider would be setting up a PPC campaign to target placements on these domains, purchasing banner ads directly from the sites or arranging for a sponsored article on the site.
Something else to keep in mind is that you can perform this same exercise on your PPC or Organic keywords to determine which keywords are sending you the highest value customers. Then, once you find them, you just need to increase your budget for those words.
By now, I hope you’re starting the see the incredible value of digging in to you Google Analytics for some serious business intelligence. To find the real gems and actionable data, you need to get creative and dig past the standard reports.
Stay tuned, because I’ve got a lot more great analytics tips that I’m sure will help you to improve your business.
But, for now, let me know what you thought about this technique in the comments below. What’s your favorite metric for monitoring your site?
